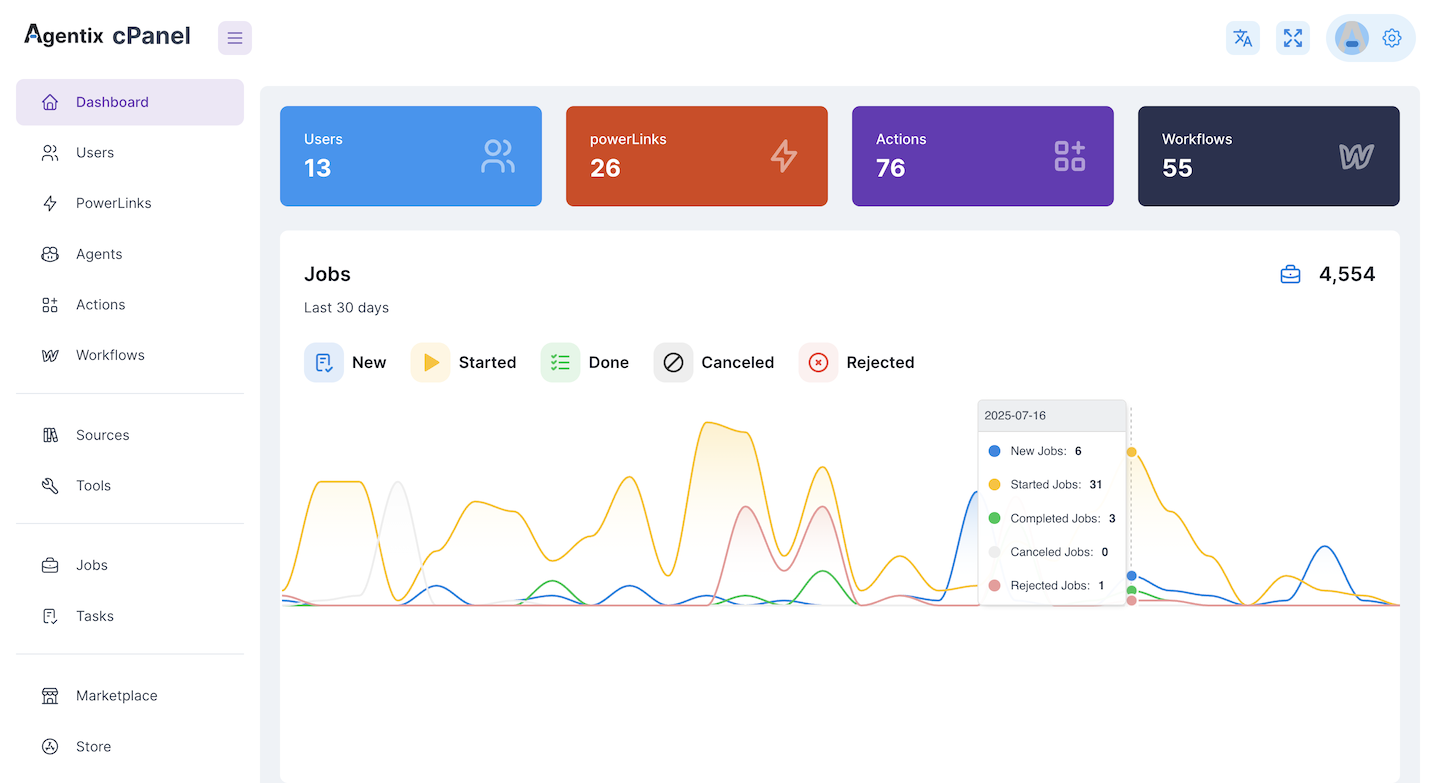
📊 Summary Metrics
At the top of the dashboard, you’ll see key counters:- 🧑🤝🧑 Users: Total number of active users in the platform.
- ⚡ PowerLinks: Number of PowerLinks installed and available.
- 🟪 Actions: Total defined actions across all PowerLinks.
- 🧩 Workflows: Number of workflow definitions created.
📈 Job Activity Chart
The Jobs graph visualizes the lifecycle of all jobs over the past 30 days. It includes:- 🔵 New Jobs: Jobs that were created but not yet started.
- 🟡 Started Jobs: Jobs actively running or being handled.
- 🟢 Completed Jobs: Successfully finished jobs.
- ⚫ Canceled Jobs: Jobs manually stopped before completion.
- 🔴 Rejected Jobs: Jobs that were intentionally declined by agents or rules.
🧠 Tip
Use this dashboard daily to:- Monitor operational health
- Spot failure patterns (e.g. spikes in rejections)
- Estimate system load across time